
Top 10 most expensive states to live in Nigeria in July 2025
Nigeria’s headline inflation rate eased for the fourth consecutive month in July 2025, dropping to 21.88% from 22.22% in June, according to the latest Consumer Price Index (CPI) report from the National Bureau of Statistics (NBS).
The figure represents a 0.34 percentage point slowdown compared to the previous month and a substantial 11.52 percentage point decline from the 33.40% recorded in July 2024.
The NBS attributed part of the sharp year-on-year decline to the recent change in the CPI base year.
On a month-on-month basis, however, inflation picked up slightly, with prices rising by 1.99% in July, compared to 1.68% in June.
This indicates that while the annual inflation rate is easing, short-term price pressures persist.
Food inflation stood at 22.74% year-on-year in July, down from 39.53% in the same month last year.
The monthly food inflation rate was 3.12%, slightly lower than June’s 3.25%. Key drivers of the monthly drop included slower price increases in vegetable oil, local rice, maize flour, guinea corn, wheat flour, and millet.
Urban inflation was 22.01% year-on-year, while rural inflation came in slightly lower at 21.08%. On a monthly basis, rural areas saw sharper price increases (2.30%) compared to urban areas (1.86%)
The latest report reveals the ten states with the steepest annual increases in the cost of goods and services, with a mix of food and non-food pressures shaping each state’s experience.
Below is a breakdown of the 10 highest-inflation states in July 2025, according to the NBS report:
-
Kaduna – 23.6%
Kaduna posted an all-items annual inflation rate of 23.6%, with food inflation at 22.0%. The monthly change in all items was 3.4%, suggesting notable short-term price pressures.
The inflation profile here shows that non-food categories such as transport, housing, and utilities are keeping pace with food prices, contributing equally to the cost burden. The state’s high monthly food inflation of 7.0% signals fresh market disruptions.
-
Nasarawa – 24.0%
With a headline rate of 24.0%, Nasarawa’s inflation is still largely food-driven, as food inflation hit 26.6% year-on-year. The monthly rise in food prices was 6.6%, compared to 3.8% for all items, suggesting that surges in food prices are pushing the cost of living higher.
-
Osun – 24.1%
Osun recorded 24.1% annual inflation for all items, with food inflation at a much steeper 29.1%. The gap points to food prices as the dominant driver, even though the monthly increases were relatively contained (2.7% for food and 2.6% for all items).
-
Abuja (FCT) – 24.2%
The Federal Capital Territory registered an all-items annual inflation rate of 24.2% and food inflation of 22.1%. Monthly changes were modest (1.8% for all items, 2.5% for food), showing some price stability. However, non-food components like accommodation, transport, and services are significant in Abuja’s inflation structure, reflecting the higher cost base of urban living in the capital.
-
Oyo – 24.6%
Oyo’s inflation rate hit 24.6% in July, with food inflation at 27.0%. Both food and non-food costs rose sharply month-on-month (3.2% for food, 3.4% for all items), indicating widespread price pressures. Food remains the main contributor, but rising costs in energy, housing, and education suggest a multi-pronged inflation problem for households in the state.
-
Taraba – 24.9%
Taraba’s all-items annual inflation was 24.9%, with food inflation at 25.5%. Interestingly, the state recorded a negative monthly change in food inflation (-0.9%), yet all-items inflation still rose by 1.8%. This points to non-food components—possibly transport and housing—driving current price increases. The moderation in food inflation may be linked to harvest-season supply improvements, even as other living costs climb.
-
Kano – 25.1%
Kano experienced an annual inflation rate of 25.1%, with food inflation at 27.4%. The monthly increases were significant (4.3% for all items, 10.9% for food), making food the clear inflation driver. This surge may be linked to supply disruptions in key northern markets and higher transportation costs, which are passed on to consumers.
-
Benue – 25.7%
Benue posted 25.7% all-items annual inflation, with food inflation at 23.5%. The smaller gap between food and headline inflation suggests that non-food categories are contributing almost equally to household cost pressures. The monthly increase was 1.4% for all items, showing a slower pace than in states like Kano, but still above the national comfort level.
-
Niger – 27.2%
Niger State’s annual inflation climbed to 27.2%, with food inflation at 24.1%. While food prices are high, the fact that the headline rate is above the food inflation rate indicates that non-food items likely energy, housing, and services are the main drivers. The monthly increases (3.8% for all items, 4.5% for food) point to sustained upward momentum across both categories.
-
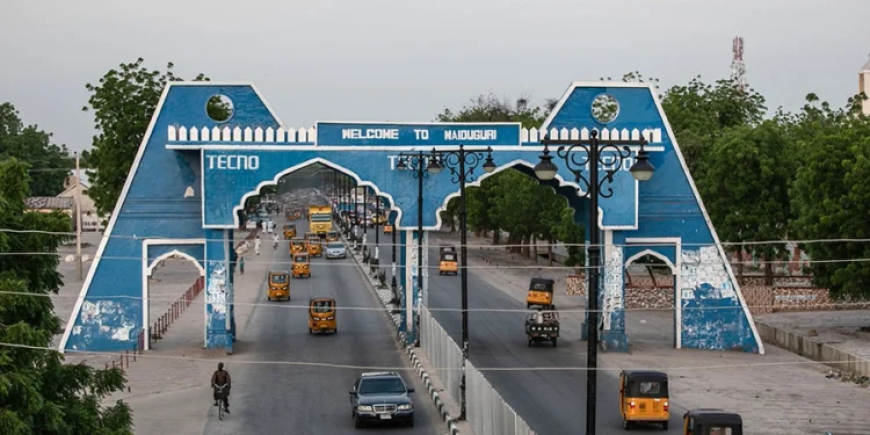
Borno – 34.5%
Borno consecutively tops the list with a staggering 34.5% all-items annual inflation, well above the national average. Food inflation reached an alarming 55.6%, more than double the national food inflation rate of 22.74%. Monthly increases were also severe (6.1% for all items, 10.9% for food), showing acute food supply challenges, possibly linked to insecurity and logistics barriers. For residents, this translates to extreme pressure on household budgets, with food costs dominating the inflation profile.
Top 10 most expensive states to live in Nigeria in July 2025 - Nairametrics